



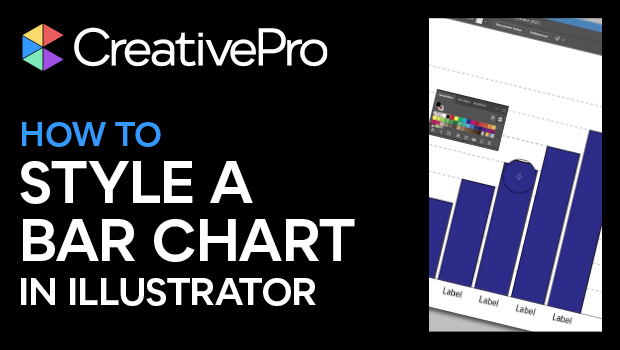
In this Illustrator how-to video, Amy Balliett gives a few helpful pointers on presenting data with bar and chart graphs. She demos how to separate the elements of the chart to individually style them and how to update the look across similar elements. Amy also points out how font and line choice can make your data stand out without being overwhelming to the reader.
This video is an excerpt from Amy’s “Visualizing Data with Charts and Graphs” session at CreativePro’s Adobe Illustrator Summit. You can also watch her “Data Visualization: Best Practices” course on LinkedIn Learning here: https://www.linkedin.com/learning/data-visualization-best-practices.
Check out our current list of events at https://development.creativepro.com/events.
Subscribe to the CreativePro YouTube channel for more helpful design tips!
This article was last modified on August 29, 2025
This article was first published on January 8, 2024
Commenting is easier and faster when you're logged in!

Recommended for you
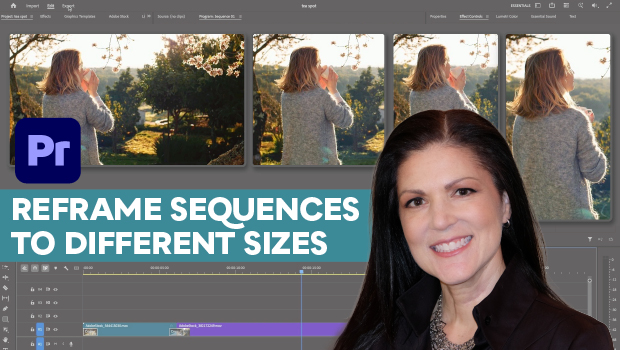
How to Export Videos in Different Aspect Ratios from Premiere
Quickly reframe your video for any social media platform with Myra Ferguson.

Premiere: It’s Not Just For Video
Designers using InDesign and Photoshop can look at Premiere as a surprising reso...

Reduce PDF File Size the Smart Way in Acrobat
Shrink your PDF file size in Acrobat with Bart Van de Wiele.